For years, UGC has been measured with soft metrics.
Views.
Likes.
Shares.
Comments.
Engagement rate.
Nice numbers. Impressive charts.
But here’s the uncomfortable question modern growth teams are asking:
How does UGC actually impact revenue?
Not vibes.
Not awareness.
Not “social proof value.”
Revenue.
As UGC platforms mature, reporting dashboards are becoming more than creative analytics tools. They’re evolving into ROI measurement systems.
And the brands that treat UGC as infrastructure — not decoration — are the ones demanding harder numbers.
The Problem: UGC Was Historically Measured in Isolation
Most UGC platforms started inside performance marketing teams.
So the dashboards were built around:
- CPM
- CTR
- Hook rate
- Thumb-stop rate
- Watch time
- CPA
These are useful. Especially for paid social.
But they only tell part of the story.
Because UGC doesn’t just influence ads.
It influences:
- Landing page behavior
- Demo bookings
- Free trial signups
- Add-to-cart rates
- Checkout completion
- Sales cycle velocity
- Renewal confidence
When UGC lives across the funnel, ad-only reporting underestimates its real impact.
The real ROI question becomes:
What happens to conversion behavior when authentic proof is visible?
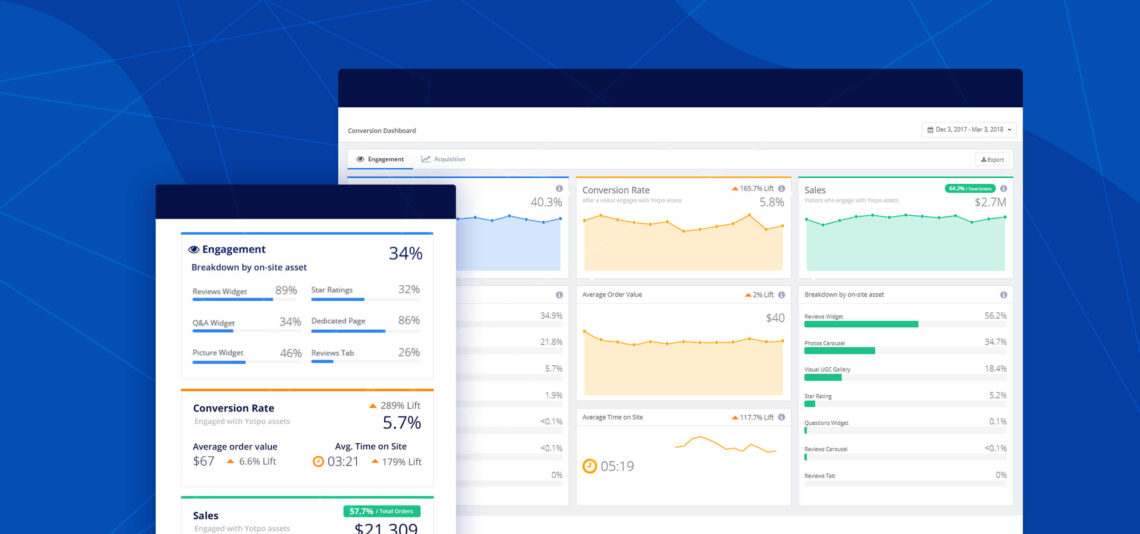
The Shift: From Creative Metrics to Conversion Lift
Modern reporting dashboards in UGC platforms are moving toward impact modeling.
Instead of just asking:
“How did this video perform as an ad?”
They’re asking:
“What changed in user behavior when this proof was present?”
That means tracking:
- Conversion rate before vs. after testimonial placement
- Time on page changes
- Scroll depth improvements
- Bounce rate reductions
- Assisted conversions
- Multi-touch attribution impact
The goal isn’t vanity metrics.
It’s measurable lift.
Because if UGC increases landing page conversion from 2.4% to 3.1%, that delta compounds massively over time.
And that’s where ROI becomes undeniable.
The Direct vs. Assisted ROI Debate
One of the most misunderstood aspects of UGC reporting is attribution.
UGC rarely operates as a single-touch conversion driver.
It often plays an assist role.
For example:
A user sees a UGC ad.
Later visits the site organically.
Watches a testimonial on the pricing page.
Books a demo.
Which touchpoint gets credit?
In rigid attribution models, UGC might get undercounted.
Modern dashboards are evolving to:
- Track assisted conversion value
- Measure conversion path inclusion
- Compare sessions with vs. without testimonial exposure
- Analyze on-page engagement tied to embedded UGC
Because ROI isn’t always linear.
It’s cumulative.
And UGC often reduces friction rather than triggers first click.
On-Site UGC Reporting: The Underrated Layer
Here’s where the real shift is happening.
UGC platforms are no longer just ad creative hubs.
They’re becoming trust layer analytics tools.
Advanced reporting dashboards now aim to answer questions like:
- Do users who watch testimonial videos convert at higher rates?
- How many seconds of watch time correlates with purchase?
- Does placing video proof near pricing increase checkout completion?
- Does embedding customer stories near feature claims reduce demo abandonment?
This is fundamentally different from ad performance reporting.
It’s behavioral impact measurement.
When UGC platforms integrate with:
- GA4
- CRM systems
- Ecommerce tracking
- Demo booking tools
They can start modeling revenue influence directly.
That’s when UGC stops being a “nice to have.”
It becomes a growth lever.
What a Modern UGC Reporting Dashboard Should Include
If you’re evaluating UGC platforms, here’s what ROI-focused reporting should cover:
1. Ad Performance Metrics (Baseline)
- CTR
- CPA
- ROAS
- View-through rate
- Hook retention
These still matter. But they’re just the beginning.
2. On-Site Behavioral Impact
- Conversion rate lift with testimonial exposure
- Engagement metrics tied to embedded videos
- Scroll depth comparison
- Session duration differences
- Assisted conversion analysis
This connects proof to purchase behavior.
3. Funnel Position Reporting
UGC doesn’t impact every funnel stage equally.
Dashboards should segment:
- Top-of-funnel performance
- Mid-funnel engagement
- Bottom-of-funnel conversion impact
For example:
Video UGC may drive clicks at the top.
Testimonial proof may drive purchase at the bottom.
If reporting doesn’t differentiate, ROI modeling becomes distorted.
4. Lifetime Value Signals
For SaaS especially, ROI isn’t just about acquisition.
UGC can influence:
- Demo close rates
- Sales cycle speed
- Renewal confidence
- Expansion likelihood
Advanced dashboards should connect UGC exposure to downstream metrics — not just initial conversion.
This is where integration with CRM becomes powerful.
The Automation Layer in Reporting
Another major evolution in UGC dashboards is automation.
Manual reporting kills momentum.
Modern systems now:
- Auto-tag UGC placement
- Track performance across pages
- Generate comparison reports
- Identify top-performing proof types
- Surface underperforming placements
Automation doesn’t just scale collection.
It scales insight.
And insight is what turns UGC from creative output into strategic investment.
Why ROI Measurement Changes UGC Strategy
When brands can clearly see ROI impact, behavior changes.
Instead of:
“Let’s add a testimonial here.”
It becomes:
“We saw a 12% lift when video proof was placed near pricing. Let’s expand that.”
Instead of:
“UGC performs well in ads.”
It becomes:
“Users who watch at least 15 seconds of testimonial video convert 28% more often.”
Those insights shift budget allocation.
They influence CRO priorities.
They change how teams think about proof.
UGC moves from marketing asset to revenue infrastructure.
The Infrastructure Approach
Some newer UGC platforms are being built with this ROI-first mindset.
Rather than focusing only on creator sourcing or content hosting, they emphasize:
- Frictionless video collection
- Embedded consent
- Easy on-site deployment
- Behavioral tracking
- Performance visibility
Platforms like Vidlo, for example, approach UGC not as a creative marketplace but as a trust infrastructure system. When video testimonials are collected and deployed seamlessly across the funnel, reporting becomes more meaningful — because exposure is consistent and measurable.
That consistency makes ROI modeling clearer.
You can’t measure impact if placement is chaotic.
You can’t optimize trust if proof is sporadic.
Infrastructure makes measurement possible.
The Competitive Advantage of Measurable Trust
Here’s the bigger picture.
In 2026, everyone can produce content.
Few can measure trust.
Brands that can directly correlate UGC exposure to:
- Higher conversion rates
- Lower CPA
- Increased LTV
- Faster sales cycles
Will justify investment confidently.
Brands that rely on engagement metrics alone will struggle to defend budgets.
The trust war is no longer just about collecting authentic content.
It’s about proving that authenticity drives revenue.
Final Thought: ROI Is the Language of Growth
UGC used to be justified emotionally.
“It feels authentic.”
“It builds credibility.”
“Customers like it.”
Now, it needs to be justified financially.
The evolution of reporting dashboards inside UGC platforms reflects that shift.
Because when authentic proof is visible, friction decreases.
When friction decreases, conversion increases.
When conversion increases, ROI becomes measurable.
And once ROI is measurable, UGC stops being an experiment.
It becomes a system.